PAPER & PAPERBOARD PRODUCTION & CONSUMPTION FOR EUROPE
| HOME | COUNTRY WISE STATISTICS |
| S.N. | Particular | Time of Information | Source | |
| 01 | Continent | Europe | ||
| 02 | Population (Million) | 747.8 | 2020(E) | https://www.worldometers.info/ |
| 03 | Total Pulp/Paper/Paperboard Production | 102.810 | 2019 | FAO |
| 03.1 | Corrugated/Packaging | 57.448 | ||
| 03.2 | Newsprint | 6.820 | ||
| 03.3 | Graphic Paper (New Classification) | 33.029 | ||
| 03.4 | Others | 5.000 | ||
| 04 | Import | 53.240 | ||
| 05 | Export | 66.969 | ||
| 06 | Net Consumption | 89.081 | ||
| 07 | Per Capita Consumption (Kg./year/person) | 119.0 | ||
| 08.0 | Recovered Paper: Collection | 61.225 | ||
| 08.1 | Import | 14.682 | ||
| 08.2 | Export | 22.473 | ||
| 08.4 | Consumption/Usage | 53.434 | ||
| 09.0 | Wood Pulp: Production | 48.573 | ||
| 09.1 | Import | 18.682 | ||
| 09.2 | Export | 18.385 | ||
| 09.4 | Consumption/Usage | 48.870 | ||
| 10 | No. of Pulp/Paper Mills | 993 | 2011 | CEPI |
| 11 | Main Raw Materials | Hardwood, Softwood & Recycled Paper | 2011 | CEPI |
| 12 | Major Companies |
All Production, Import, Export and
Net Consumption numbers are in Million Metric Tons
(1,000,000,000 Kg.)
Please provide if you have the latest info. If you want to write
a Blog please send me at wecare@paperonweb.com
and I will review it and publish
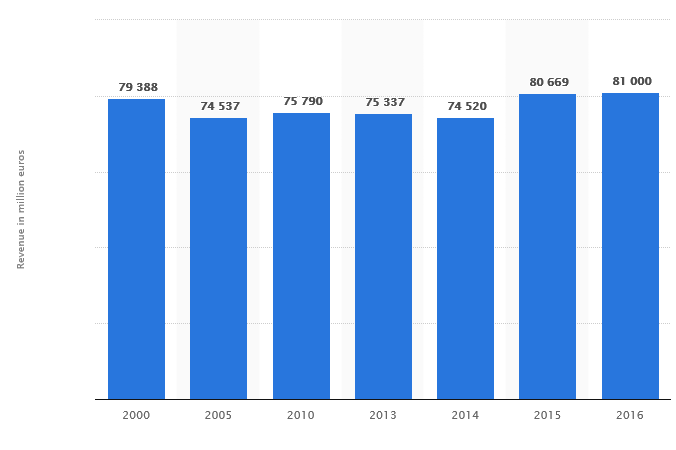
European Pulp & Paper Industries Revenue 2000-16
European recovered paper statistics 2016 by ERPA
04 JUL.2016
European paper industry: Structural change continues, overall positive performance
In 2015, the European paper industry's performance in total was second best in the world after China, with a stable production and increased consumption compared to 2014. The packaging sector's production continued to increase whilst graphic paper (newsprint, printing and writing paper) maintained its recent decline. This and other figures can be found in the Confederation of European Paper Industries (CEPI)'s recently-launched 2015 Key Statistics brochure, which gives a clear picture of the industry's performance last year. The report includes data on production, consumption and the trade of pulp, paper and raw materials, as well as on energy and environment.
Here are the main highlights of
the report:
- CEPI members produced 90.9 million tonnes of paper and board.
This corresponds to a slight decrease of 0.2% in 2014 and
relative stability over the last three years. The operating rate
for 2015 was 91.2%, up from 89.7% in 2014.
- Graphic grades (newsprint, writing and printing paper) represented 38.8% of all paper and board produced in Europe in 2015, packaging grades 49.0%, sanitary and household papers 7.9% and speciality grades 4.3%.
- The overall output performance of CEPI countries in total was slightly better than in most other major traditional paper producing regions of the world, with a fall in production recorded in all regions except China. Paper and board production decreased in Brazil (-0.5%), South Korea (-0.9%), the USA (-1.0%), Japan (-1.0%) and Canada (-7.4%). Production in China rose by 2.3% compared to 2014.
- Consumption rose for the second year in a row by 0.5% compared to 2014, totalling 77.4 million tonnes. The economic recovery observed in the EU28 and the euro area in 2015 - annual GDP increase by 2.0% and 1.7% respectively (source: Eurostat) - had a positive impact on paper and board demand.
- CEPI countries maintained an overall positive paper and board trade balance (exports exceeding imports) of 13.5 million tonnes in 2015, compared to 14.0 million tonnes in 2014.
- Market pulp production fell by 0.7% compared to 2014, with an output of 13.1 million tonnes.
Ernst & Young issued a limited assurance statement on the data quality rating that CEPI carried out on its core indicators in the statistics report. You can download it as well as the Key Statistics report in PDF format from CEPI's website atwww.cepi.org/topics/statistics or request your own paper copy by sending an email to mail@cepi.org.
More detailed statistical information is available to non-CEPI members by subscription. A full report can be ordered by contacting Ariane Crèvecoeur, by telephone +32 (0)2 62749 35 or email at a.crevecoeur@cepi.org or Eric Kilby at e.kilby@cepi.org.
Key Statistics of 2015 by CEPI
Please note CEPI includes only Austria, Belgium, Czech Republic, Finland, France, Germany, Hungary, Italy, Netherlands, Norway, Poland, Portugal, Romania, Slovak Republic, Slovenia, Spain, Sweden, UK from Europe.
CEPI does not include: Albania, Andorra, Belarus, Bosnia, Bulgaria, Croatia, Denmark, Estonia, Greece, Iceland, Ireland, Latvia, Lithuania, Luxemburg, Macedonia, Malta, Moldova, Montenegro, Russia, Serbia, Switzerland and Ukraine.
Europe 2015 Statistics from CEPI (Confederation of European Paper Industries)
| 2000 | 2015 | % Change from 2000 - 2015 | |
| INDUSTRY STRUCTURE | |||
| Number of Companies | 948 | 633 | -33.2% |
| Number of Mills | 1,335 | 917 | -31.3% |
| - Pulp | 237 | 154 | -35.0% |
| - Paper & Board | 1,098 | 763 | -30.5% |
| # of Paper Machines | 1,896 | 1,288 | -32.1% |
| Employment | 309,954 | 178,212 | -42.5% |
| WOOD CONSUMPTION (Million M3) | |||
| Consumption | 150.192 | 144.567 | -3.7% |
| Hardwood | 40.947 | 40.485 | -1.1% |
| Softwood | 109.245 | 104.082 | -4.7% |
| PULP (Million MT) | |||
| Production of Market Pulp | 11.579 | 13.087 | +13.0% |
| Production of Total Pulp | 40.247 | 36.265 | -9.9% |
| Export to Outside CEPI | 1.835 | 3.292 | 79.4% |
| Import from Outside CEPI | 8.003 | 8.115 | 1.4% |
| Consumption | 46.996 | 41.088 | -12.6% |
| PAPER (Million MT) | |||
| Production | 92.603 | 90.872 | -1.9% |
| Export to Outside CEPI | 16.745 | 18.915 | |
| Import from Outside CEPI | 4.953 | 5.459 | |
| Consumption | 85.087 | 77.146 | -9.3% |
| PAPER FOR RECYCLING (Million MT) | |||
| Collection | 44.878 | 55.935 | +24.6% |
| Utilization | 42.068 | 47.710 | +13.4% |
| Export to Outside CEPI | 7.558 | 10.175 | |
| Import from Outside CEPI | 0.931 | 1.950 | |
| Utilization Rate | 45.4% | 52.5% | +7.1% |
| Recycling Rate | 51.8% | 71.5% | +19.7 |